Grafana
Operational dashboards for the CI/CD and Kubernetes system.
How This Fits Our End-to-End Pipeline
Grafana is documented here as part of one connected build, not as an isolated tutorial. The goal is to explain how code moved from a developer laptop into a monitored Kubernetes service.
Developer laptop
  | git add / commit / push
  v
GitHub repository
  | pull request + branch rules
  v
GitHub Actions workflow
  | test -> docker build -> tag -> push
  v
Docker Hub image registry
  | immutable image tag
  v
GitOps manifests repository/path
  | ArgoCD watches desired state
  v
Kubernetes cluster
  | app pods + services + ingress
  v
Prometheus scrapes metrics -> Grafana dashboards
Theory
Grafana visualizes metrics from Prometheus and other data sources. It turns raw time series into dashboards, panels, alerts, and operating views that humans can understand during normal releases and incidents.
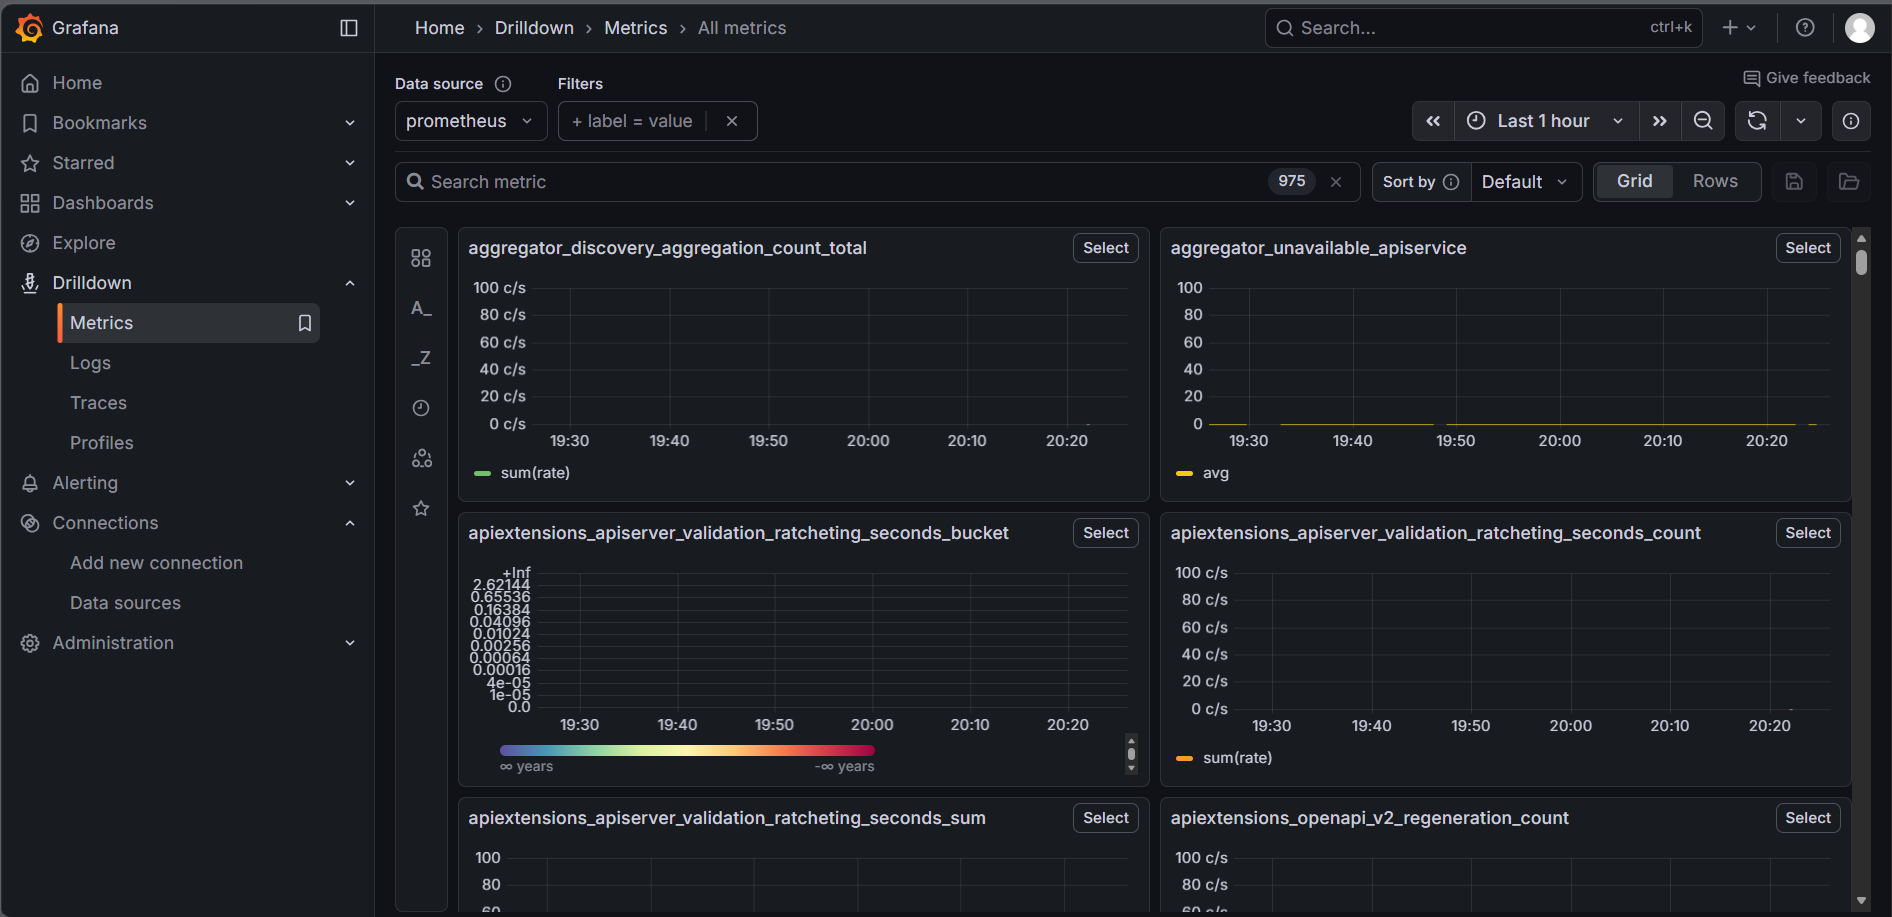
In our project, Grafana is the final feedback loop: after GitHub Actions publishes an image and ArgoCD syncs Kubernetes, Grafana helps confirm whether the application is healthy.
Dashboard Flow
Prometheus data source
        |
        v
Grafana dashboard
        |
        +-- service health row
        +-- deployment version panel
        +-- request rate / error rate / latency
        +-- CPU / memory / restarts
        +-- Kubernetes namespace overview
Implementation
- Add Prometheus as a Grafana data source.
- Create a service dashboard for the app namespace and deployment.
- Add panels for uptime, request rate, errors, latency, CPU, memory, and restarts.
- Add variables for namespace, deployment, and pod so one dashboard can inspect multiple workloads.
- Save dashboard JSON in Git once the dashboard becomes part of the operating model.
Panel Examples
| Panel | Query idea | Why it matters |
|---|---|---|
| Request rate | sum(rate(http_requests_total[5m])) | Shows traffic volume before and after deployment. |
| Error rate | sum(rate(http_requests_total{status=~"5.."}[5m])) | Shows whether the release increased failures. |
| Pod restarts | increase(kube_pod_container_status_restarts_total[15m]) | Catches crash loops and unstable containers. |
| Memory | container_memory_working_set_bytes | Helps detect leaks and capacity pressure. |
Release Review Dashboard
A useful release dashboard shows the deployed image version, request traffic, errors, latency, restarts, CPU, and memory in the same time window. That lets us compare system behavior before and after ArgoCD syncs a new image.
Dashboard Design Notes
- Put the most important health signal at the top left because people scan dashboards under stress.
- Group app panels separately from cluster panels so ownership is clear.
- Use consistent time ranges when comparing before and after a deployment.
- Avoid dashboards that only look impressive; every panel should answer a real operational question.
Commands and Access
Port forward Grafana
kubectl port-forward svc/grafana 3000:80 -n monitoringOpens Grafana locally in a learning cluster.
Check monitoring namespace
kubectl get pods -n monitoringConfirms Prometheus and Grafana are running.
Export dashboard
# Grafana UI -> Dashboard settings -> JSON modelSave useful dashboards in Git for repeatability.
Interview Notes
- Grafana is a visualization and alerting layer; Prometheus is the metrics database in this setup.
- A data source connects Grafana to Prometheus, Loki, Tempo, cloud monitoring, or SQL stores.
- Dashboard variables make panels reusable across namespaces and services.
- Good dashboards support decisions; they are not just charts.
- Alert rules should include context and a runbook link when possible.
FAQs
Can Grafana store metrics?
Grafana normally visualizes metrics from data sources. Grafana Cloud and related products can provide storage, but plain Grafana dashboards query external systems.
Should dashboards be committed to Git?
Yes when they are important to operations. Export JSON or use provisioning.
What should we check after deployment?
App availability, error rate, latency, pod restarts, CPU and memory, and whether the deployed image version matches the expected release.
Memorize vs Look-up
Memorize
- Data source, dashboard, panel, variable, alert rule.
- Prometheus is queried with PromQL from Grafana panels.
- Dashboards should answer operational questions.
Look Up
- Exact panel JSON format.
- Provisioning file schemas.
- Plugin-specific visualization options.
Project Implementation Journal
Baseline
We first made sure the application or configuration worked before introducing Grafana. A broken baseline makes every later automation failure harder to understand.
Local proof
We validated the Grafana workflow locally where possible, because local feedback is faster than waiting for CI or a cluster reconciliation loop.
Repository proof
We committed the Grafana change as a reviewable unit so the reason for the pipeline change was visible in Git history.
Automation handoff
We connected Grafana to the next tool in the chain instead of treating it as a standalone exercise.
Failure check
We intentionally inspected the common failure signals for Grafana: logs, status output, permissions, names, tags, and configuration paths.
Rollback thinking
We asked how to return to the previous working state if the Grafana change caused a bad deployment.
Interview compression
We reduced Grafana into a few sentences that explain purpose, implementation, and failure modes clearly.
Operations note
We documented what someone should check the day after the deployment, not only what to run during setup.
Decision Records
- Keep Grafana configuration in Git where it can be reviewed.
- Prefer explicit names over clever names: repository, image, namespace, workflow, and application names should be searchable.
- Use immutable versions for anything that can be deployed or rolled back.
- Put secrets in the platform secret store, not in code, documentation screenshots, or shell history.
- Automate only after the manual path is understood.
- Make the happy path visible, then document the first five things to check when it fails.
- Separate staging and production concerns before the project becomes too large.
- Choose boring defaults unless there is a real operational reason to customize.
- Write commands so they can be pasted into a terminal after replacing obvious placeholders.
- Treat dashboards, manifests, and workflow files as production code once people rely on them.
Failure Modes We Learned To Recognize
Wrong name
The most ordinary failures came from mismatched names: image repository, namespace, service selector, branch, workflow file, or dashboard variable.
Wrong permission
Automation failed when a token could read but not write, push but not pull, or access staging but not production.
Wrong version
A deployment looked successful while the cluster still ran an old image tag or an image tag that had been overwritten.
Wrong assumption
A command that worked locally failed in CI because the runner had a different shell, path, network, or credential context.
Missing feedback
Without logs, status commands, metrics, or dashboards, the system gave no quick answer about what changed.
Manual drift
Manual cluster edits solved a momentary problem but made the GitOps source of truth inaccurate.
Interview Drill Questions
- What problem does Grafana solve in this pipeline?
- What artifact or state does Grafana produce?
- Which tool consumes the output of Grafana next?
- What is the most likely beginner mistake with Grafana?
- How would you prove Grafana worked without guessing?
- How would you roll back a bad change involving Grafana?
- What should be memorized versus looked up for Grafana?
- Which security boundary matters most for Grafana?
- How would you explain Grafana to someone who only knows basic Linux?
- What metric, log, status, or command would you check first during an incident?
Glossary For This Stage
Artifact
A build output or configuration object that can be handed to another stage.
Desired state
The state declared in Git or YAML that controllers try to make real.
Reconciliation
The loop where a tool compares desired state with actual state and fixes differences.
Immutable version
A version reference that should never change meaning after publication.
Rollback
A controlled return to a previously known working state.
Drift
A difference between what Git says should exist and what is actually running.
Health
A status signal that says whether the service is ready and operating correctly.
Traceability
The ability to connect a running system back to a commit, workflow run, image, and manifest change.
Practical Runbook
Confirm source
Identify the exact repository, branch, commit, file path, or dashboard connected to Grafana.
Confirm identity
Check the account, token, kube context, registry namespace, or runner label before assuming the tool is broken.
Confirm version
Write down the version or tag you expected and compare it with the version the platform reports.
Confirm status
Use the native status command or UI first; it usually tells you whether the failure is configuration, permission, or runtime.
Confirm logs
Logs explain what happened after the tool accepted the configuration but the process still failed.
Confirm network
Many CI/CD failures are actually DNS, registry, cluster, firewall, or service discovery failures.
Confirm ownership
Know whether the application team, platform team, security team, or repository owner controls the failing setting.
Confirm rollback
Before changing more things, decide whether the quickest safe move is to revert, resync, rebuild, or redeploy.
Confirm documentation
After fixing the issue, add the command, symptom, and fix to the project notes so the next run is faster.
Confirm automation
If the Grafana step is repeated manually more than twice, turn it into a workflow, manifest, script, or checklist.
Verification Checklist
- Can I point to the exact Git commit connected to this Grafana change?
- Can I explain what changed in one sentence?
- Can I prove the change worked with a command or status screen?
- Can I identify the next tool that consumes this output?
- Can I identify the secret, token, or permission that would break this step?
- Can I roll back without manually editing production state?
- Can I tell whether the failure is build-time, deploy-time, or runtime?
- Can I show the relevant logs or metrics?
- Can I repeat the setup on a fresh machine or cluster?
- Can I teach this stage without reading every command from the page?